
Some filings are due periodically. Others are filed following an event. We examine the frequency of SEC filings over the last four years.
All filings
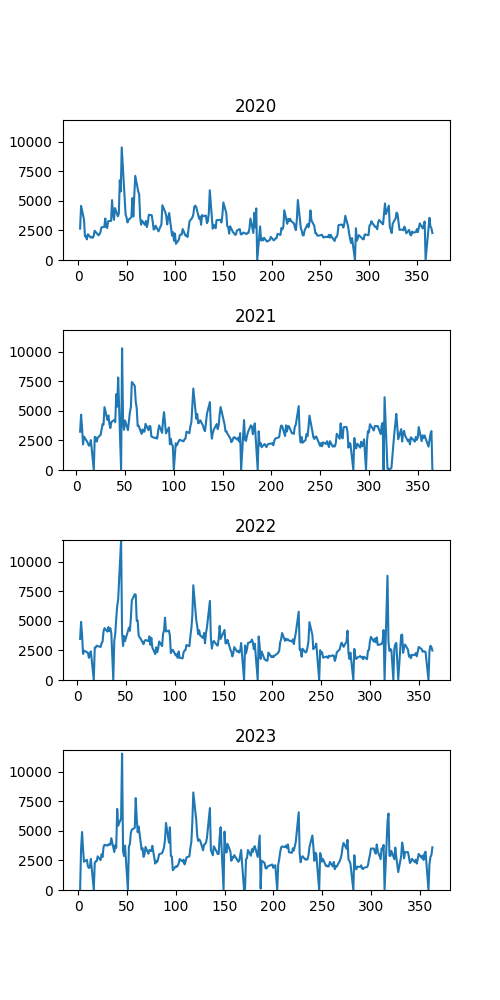
The plots above show the number of filings by date for the last four years. For clarity, the x-axis is the Julian date (i.e., February 1 is day 32). Similarly, the days with no filings (most weekends and holidays) are not plotted. The days when the plot appears to touch the origin are weekends/holidays with a few (not zero) filings.
The peak each year is in the middle of February. There is an overall cycle that is shown year to year.
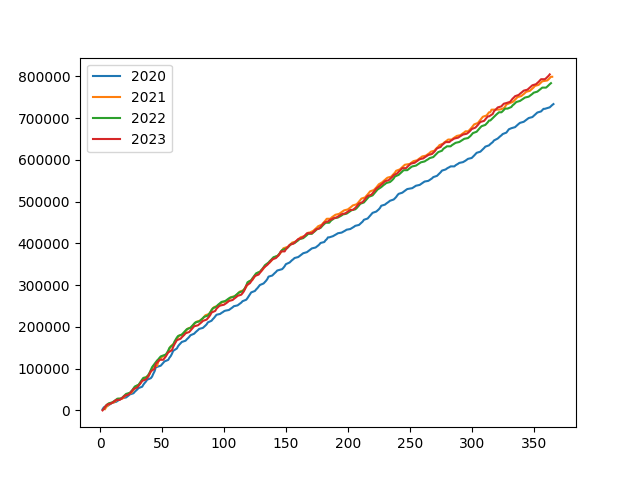
The plot above shows the cumulative distribution of filings for each year. The plot are very similar indicating that the reportable business activity is quite constant.
Top filings
Nearly 3.5 millions forms were filed with the SEC in 2020-2024. Five forms are much more frequent than the others, which can seen on the status page.
| Form | % | Description |
|---|---|---|
| 4 | 24% | Statement of changes of beneficial ownership of securities |
| 8-K | 9.0% | Events or changes between quarterly reports |
| 424B2 | 7.5% | Prospectus of a primary offering of securities |
| D | 7.0% | Notice of an exempt offering of securities |
| NPORT-P | 6.2% | Quarterly mutual fund report |
Form 4
The most common form filed with the SEC is Form 4. This form is used to disclose purchases and sales of stocks and options. Officers, directors, and 10%-owners must report these actions within two business days.
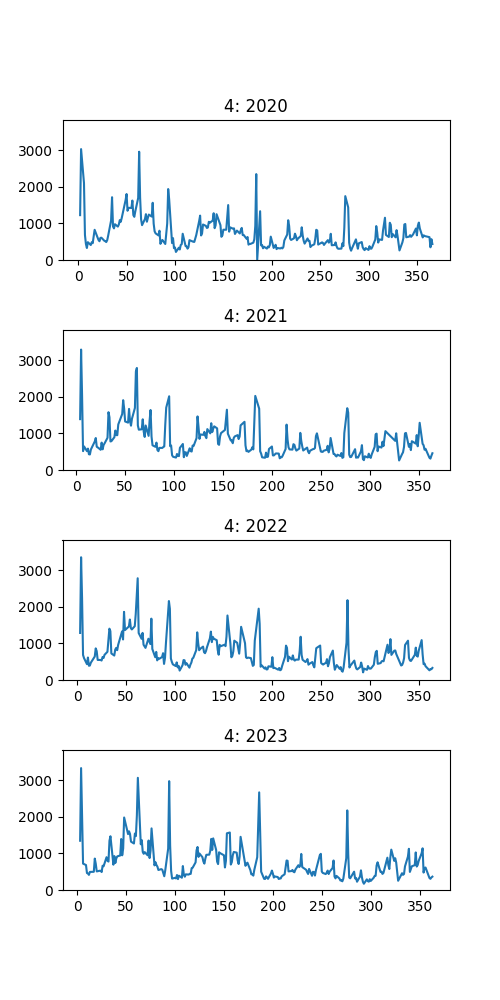
The plots above show the number of Form 4 filings per day of the year (Julian date) for the last four years. The peak is always the first week of the year. No doubt a tax related action. The are three other peaks each quarter, which are probably related to paying estimated taxes.
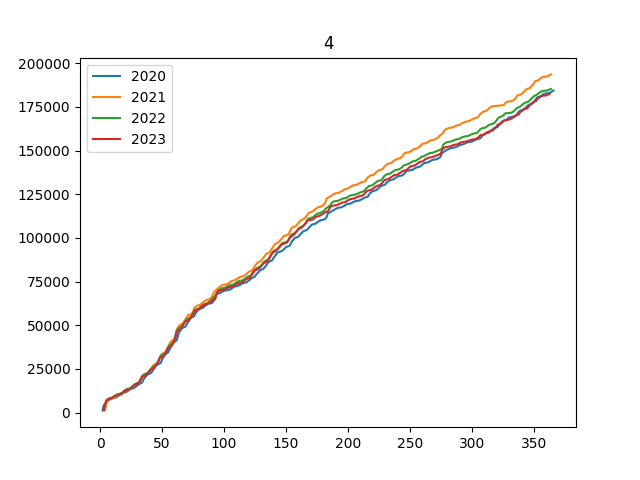
The chart above plots the CDF (cumulative distribution function) for Form 4 by year. The CDF of Form 4 filings is quite similar each year.
This study only considers the filing itself. It does not consider whether the security is bought or sold, the volume or value of the transaction, etc. Moreover, a single filing may list many transactions. So this is a coarse study. An in-depth study may be the subject of a future post.
Form 8-K
The Form 8-K reports unscheduled events that could be of importance to the shareholders or the SEC. Events must be reported within four business days. Events are classified under an Item. Examples:
- Item 1.03 - Bankruptcy or Receivership
- Item 3.02 - Unregistered Sales of Equity Securities
- Item 4.01 - Changes in Registrant's Certifying Accountant
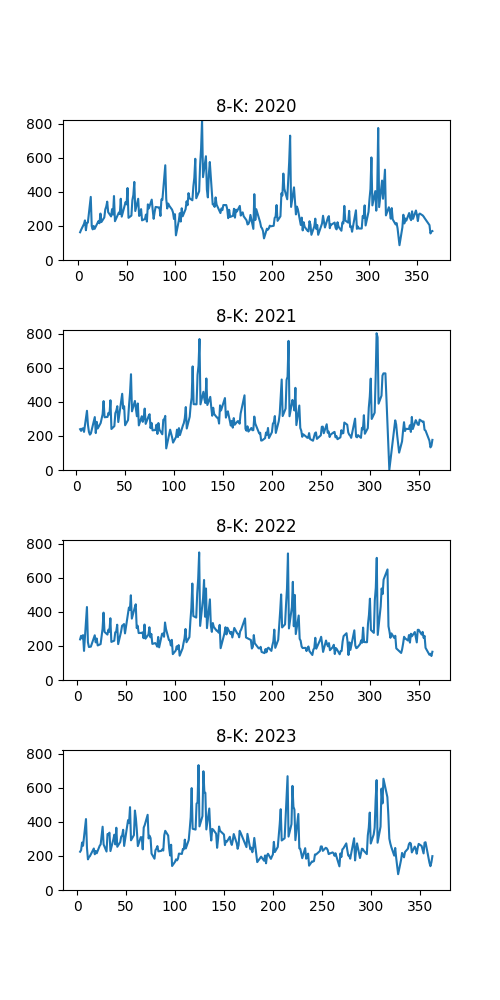
The plots above show the number of Form 8-K filings per day for the last four years. The regularity of for these unscheduled events is surprising. There are distinct peaks at the end of the first, second, and third quarters but none after Q4. It is not clear why unscheduled events occur most frequently at the end of quarters.
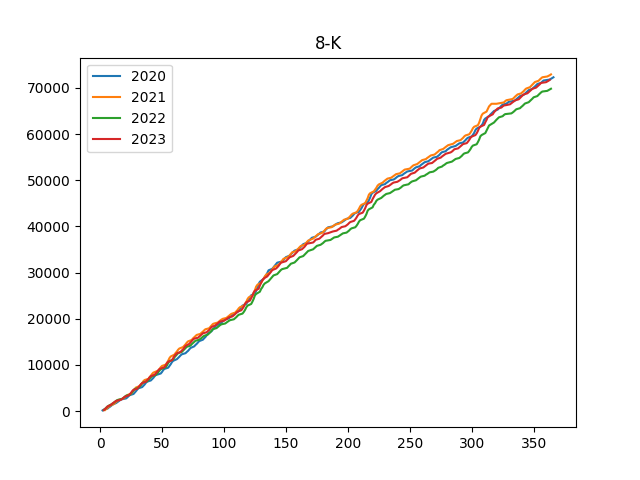
The above chart plots the CDF for Form 8-K by year. Each year is very similar. One might expect that the COVID year 2020 might have had an unusually high number of unexpected events. But the data do not show that.
A future post will examine 8-K filings by item.
Form 424B2
Form 424B2 is the prospectus a company files when making a primary offering of securities on a delayed basis.
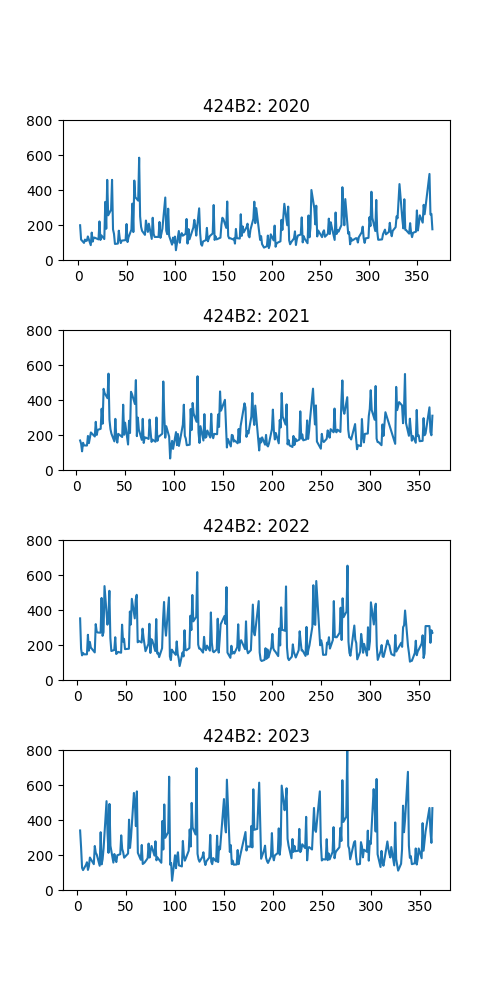
The plots above show the number of Form 424B2 filings per year. These filings tend to peak at the end of each month. Because a prospectus can be scheduled for any day of the year, this is likely an artifact of project schedules.
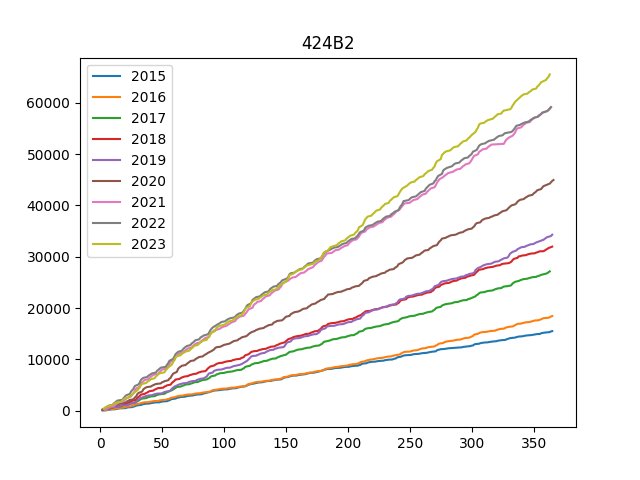
The above chart plots the CDFs of Form 424B2 filings by year. It includes the last nine years because, unlike others forms, the number of Form 424B2 filings varied significant by year and increased almost 4 fold.
| Year | 424B2 filings | % increase |
|---|---|---|
| 2015 | 15,495 | -- |
| 2016 | 18,439 | 19 |
| 2017 | 27,151 | 47 |
| 2018 | 31,980 | 18 |
| 2019 | 34,307 | 7.3 |
| 2020 | 44,970 | 31 |
| 2021 | 59,138 | 32 |
| 2022 | 59,198 | 0.10 |
| 2023 | 65,567 | 11 |
The table above shows the number of Form 424B2 filings in each of the last ten year along with the year-to-year change.
Form D
The Form D is a notice of an offering of securities under Regulation D.
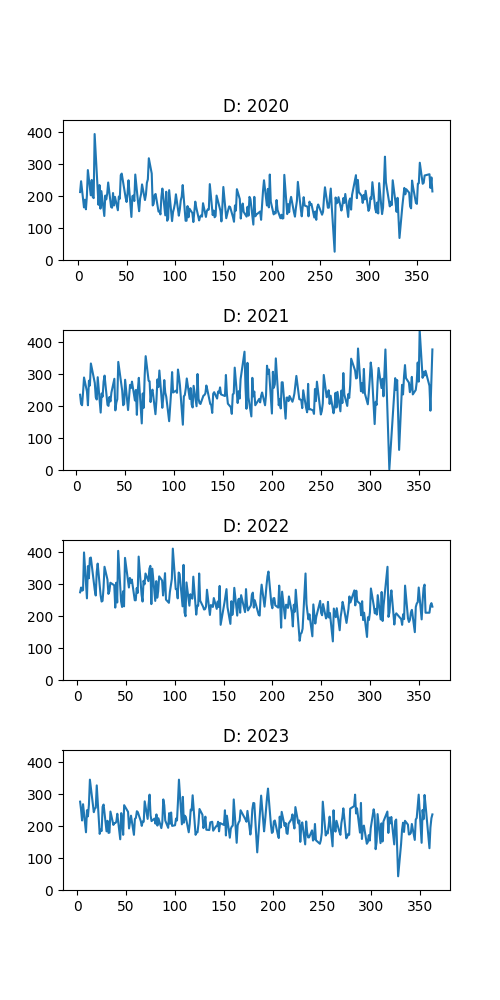
The plots above show the number of Form D filings per day by year. Of the top forms, Form D is the least cyclic. There are no significant or recurring peaks and valleys.
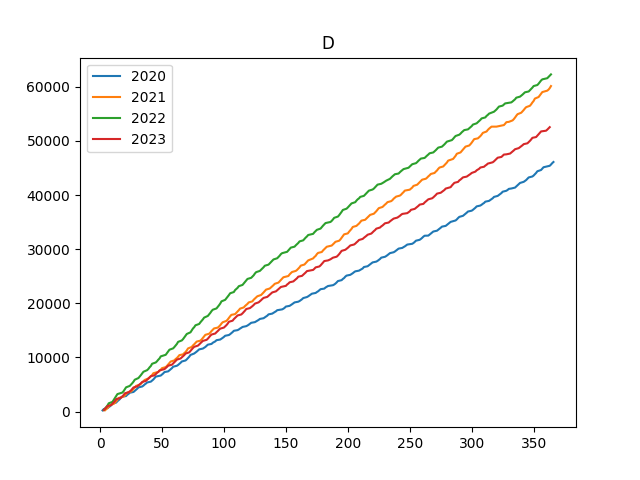
The above chart plot CDF for Form D filings by year. The total number of filings varies year over year.
| Year | Form D filings | % increase |
|---|---|---|
| 2015 | 38,970 | -- |
| 2016 | 39,790 | 2.1 |
| 2017 | 41,944 | 5.4 |
| 2018 | 44,689 | 6.5 |
| 2019 | 45,804 | 2.5 |
| 2020 | 46,103 | 0.65 |
| 2021 | 60,130 | 30 |
| 2022 | 62,285 | 3.6 |
| 2023 | 52,540 | -16 |
The table above shows the number of yearly Form D filings and the year-to-year increase.
Form NPORT-P
Registered management investment companies and ETFs must file monthly reports on each fund's portfolio. However, only the quarterly reports are public: NPORT-P. Companies must file a non-public report, NPORT-NP, in the other months. This section only discusses the public reports.
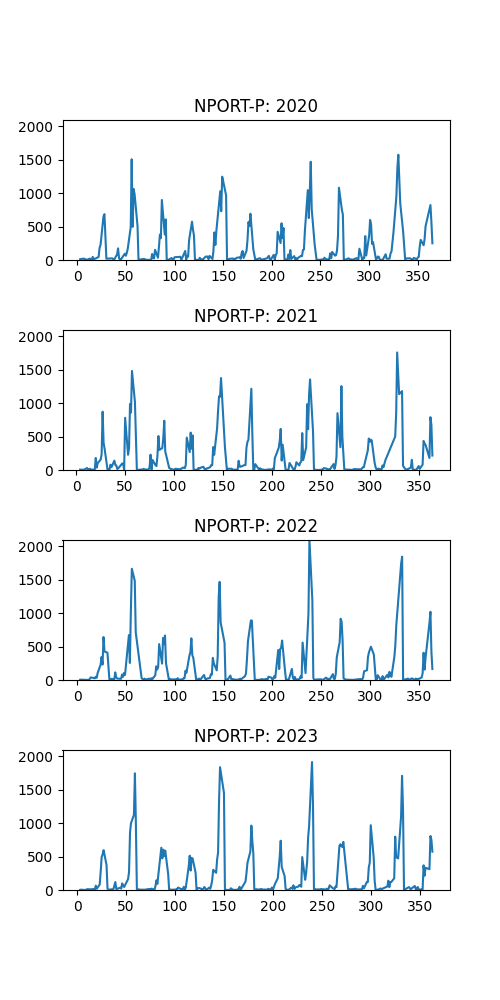
The above charts show the number of NPORT-P filings per day by year. More than any other form, the NPORT-P is highly cyclic. The are other twelve, monthly peaks per year. Four of those peaks are higher than the others. The form must be filed within 60 days of the close of the quarter. The highest peaks occur 60 days after the end of the calendar quarters (March, June, September, and December).
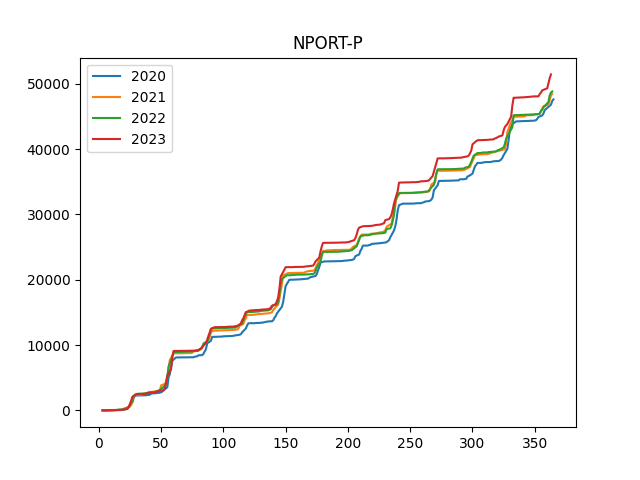
The cyclic nature of the NPORT-P filings is evident in the CDFs plots above.