Company officers, directors, and owners of at least 10% of a company must disclose transactions of their company's stock in a Form 4 with in two business days. An earlier article looked at the frequency of Form 4 filings. That coarse study only looked at the filings by date. But it does not look at the details of the transaction. Moreover, a single filing often discloses more than one transaction. This article looks at the transaction individually and disposition of the transaction: whether it was acquired or disposed (of).
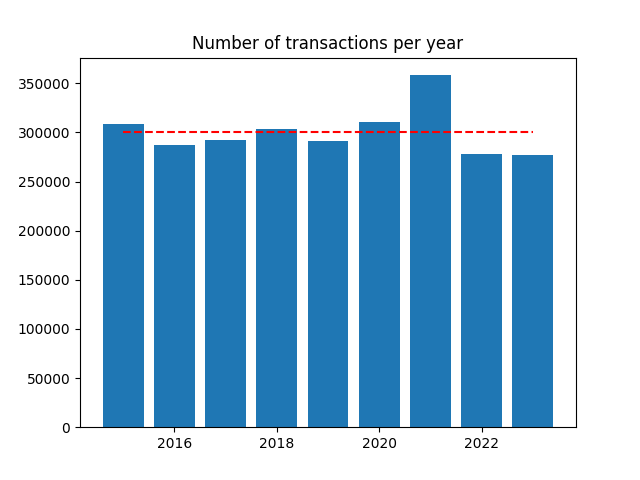
The chart above shows the total number transactions per year for the last 9 years. The year 2021 appears to be an outlier. The red line shows the average number of transactions per year. This chart does not distinguish between buying and selling. The chart below adds this detail.
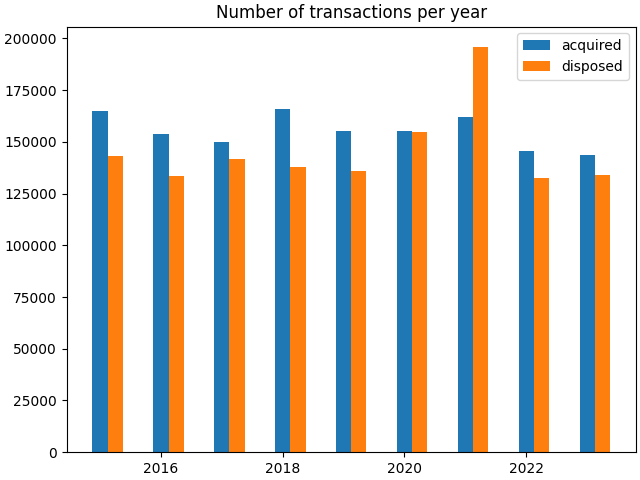
We see that 2021 is an outlier because there were more transactions that disposed of stock than acquired, which accounts for the spike in total transactions.
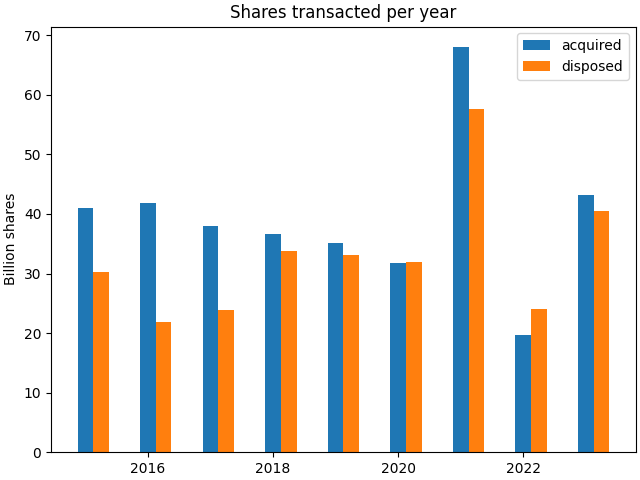
These charts plot the number of transactions. The chart below shows the total number shares of transacted. It shows that in general more shares are acquired than disposed of. Interestingly, that is true in 2021, indicating the average acquisition was larger than the average disposal.
For those who prefer tables to charts, the table below has the numbers that created the plots above.
| Acquired | Disposed (of) | |||
|---|---|---|---|---|
| Year | Count | Shares (B) | Count | Shares (B) |
| 2015 | 165,100 | 40.9 | 142,943 | 30.3 |
| 2016 | 153,766 | 41.9 | 133,574 | 21.8 |
| 2017 | 150,069 | 37.9 | 141,731 | 23.9 |
| 2018 | 165,731 | 36.6 | 137,988 | 33.7 |
| 2019 | 155,440 | 35.1 | 136,061 | 33.1 |
| 2020 | 155.422 | 31.7 | 154,770 | 32.0 |
| 2021 | 162,192 | 68.1 | 195,999 | 57.6 |
| 2022 | 145,719 | 19.7 | 132,620 | 24.0 |
| 2023 | 143,542 | 43.1 | 133,837 | 40.5 |
| Average | 155,220 | 39.5 | 145,503 | 33.0 |
Transaction codes
In addition to acquire and dispose, there are many transaction codes. The information below was copied from this SEC page.
General Transaction Codes
| Code | Definition |
|---|---|
| P | Open market or private purchase of non-derivative or derivative security |
| S | Open market or private sale of non-derivative or derivative security |
| V | Transaction voluntarily reported earlier than required |
Rule 16b-3 Transaction Codes
| Code | Definition |
|---|---|
| A | Grant, award or other acquisition pursuant to Rule 16b-3(d) |
| D | Disposition to the issuer of issuer equity securities pursuant to Rule 16b-3(e) |
| F | Payment of exercise price or tax liability by delivering or withholding securities incident to the receipt, exercise or vesting of a security issued in accordance with Rule 16b-3 |
| I | Discretionary transaction in accordance with Rule 16b-3(f) resulting in acquisition or disposition of issuer securities |
| M | Exercise or conversion of derivative security exempted pursuant to Rule 16b-3 |
Derivative Securities Codes (Except for transactions exempted pursuant to Rule 16b-3)
| Code | Definition |
|---|---|
| C | Conversion of derivative security |
| E | Expiration of short derivative position |
| H | Expiration (or cancellation) of long derivative position with value received |
| O | Exercise of out-of-the-money derivative security |
| X | Exercise of in-the-money or at-the-money derivative security |
Other Section 16(b) Exempt Transaction and Small Acquisition Codes (except for Rule 16b-3 codes above)
| Code | Definition |
|---|---|
| G | Bona fide gift |
| L | Small acquisition under Rule 16a-6 |
| W | Acquisition or disposition by will or the laws of descent and distribution |
| Z | Deposit into or withdrawal from voting trust |
Other Transaction Codes
| Code | Definition |
|---|---|
| J | Other acquisition or disposition (describe transaction) |
| K | Transaction in equity swap or instrument with similar characteristics |
| U | Disposition pursuant to a tender of shares in a change of control transaction |
The pie chart below shows the relative amount of each transaction.
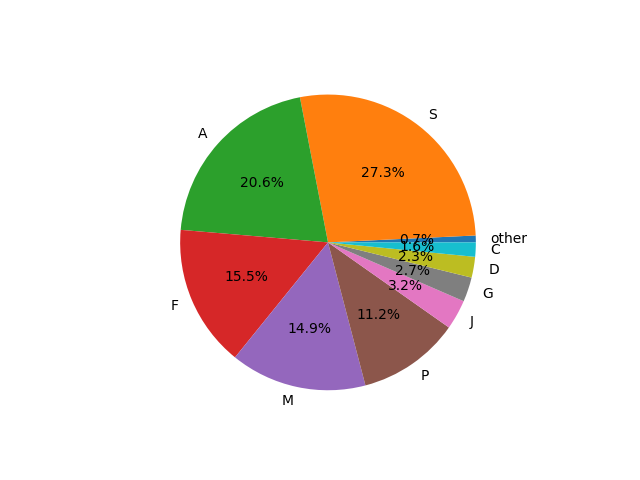
The table below shows the relative rates of all transaction codes. It is sorted by most frequent. The cumulative frequency is also shown. Almost 90% of the transactions are in 5 codes.
| Code | % | Cum % |
|---|---|---|
| S | 27.3% | 27.3% |
| A | 20.6% | 47.9% |
| F | 15.5% | 63.4% |
| M | 14.9% | 78.3% |
| P | 11.2% | 89.5% |
| J | 3.25% | 92.7% |
| G | 2.68% | 95.4% |
| D | 2.27% | 97.7% |
| C | 1.56% | 99.3% |
| L | 0.237% | 99.5% |
| X | 0.20% | 99.7% |
| U | 0.16% | 99.8% |
| I | 0.117% | 99.9% |
| W | 0.036% | 99.9% |
| Z | 0.015% | > 99.9% |
| O | 0.0040% | > 99.9% |
| E | 0.0007% | > 99.9% |
| H | 0.0004% | 100.00% |
This is a somewhat superficial examination of the data.
We will probably will not dig deeper into the data until a client
shows interest in these data.